
Global payments adoption is not a single, linear move from cash to digital. The market is becoming multi-rail and regionally differentiated.
Digital wallets and payment apps now dominate much of online commerce. Fast-payment infrastructure is spreading across jurisdictions. Mobile money is expanding access and transaction volume. Cards remain embedded in wallets and point-of-sale behavior. At the same time, cash usage and access gaps remain material.
This article uses 2024–2025 data as the latest broadly available baseline for September 18, 2026. It distinguishes current adoption from forecasts. It also separates payment usage, transaction share, account ownership, and infrastructure availability.
What global payments adoption means and which benchmarks matter
Payment adoption means observed use or acceptance of a payment method. It does not simply mean that a payment rail or account exists.
Adoption is behavior; availability is infrastructure. The two should not be treated as interchangeable. For example, a country can offer instant payments without widespread consumer or merchant usage.
The main consumer benchmarks include:
| Metric | What it measures | Best source type | Common limitation |
|---|---|---|---|
| Transaction-value share | The value processed through a payment method | Payment-industry research | May not show how many people use the method |
| Transaction volume | The number of payments made | Payment networks, providers, or regulators | Small and large payments receive equal weight |
| Account ownership | Whether people hold an account or wallet | Nationally representative surveys | Ownership does not prove active use |
| Active usage | Whether an account or service is used during a defined period | Provider or survey data | Definitions vary by source and time period |
| Infrastructure availability | Whether a payment system is accessible in a market | Central banks and international institutions | Availability does not prove adoption |
The Global Findex 2025 is based on nationally representative surveys of about 148,000 adults in 141 economies during 2024. It measures access to and use of financial services and digital connectivity.
The Global Payments Report 2026 covers 42 leading markets. Together, these markets represented 89% of global gross domestic product based on 2025 IMF data. The report analyzes payment value at e-commerce and point-of-sale checkout.
For business readers, consumer payment share is only one input. Payment adoption should also be benchmarked by corridor, currency, settlement speed, acceptance coverage, compliance requirements, and reconciliation impact.
A useful comparison is 56% of global e-commerce spend through digital wallets in 2025 versus 137 countries offering access to instant payment services as of June 2026. The first is a usage share. The second is an infrastructure-availability measure.
Global payments adoption at a glance
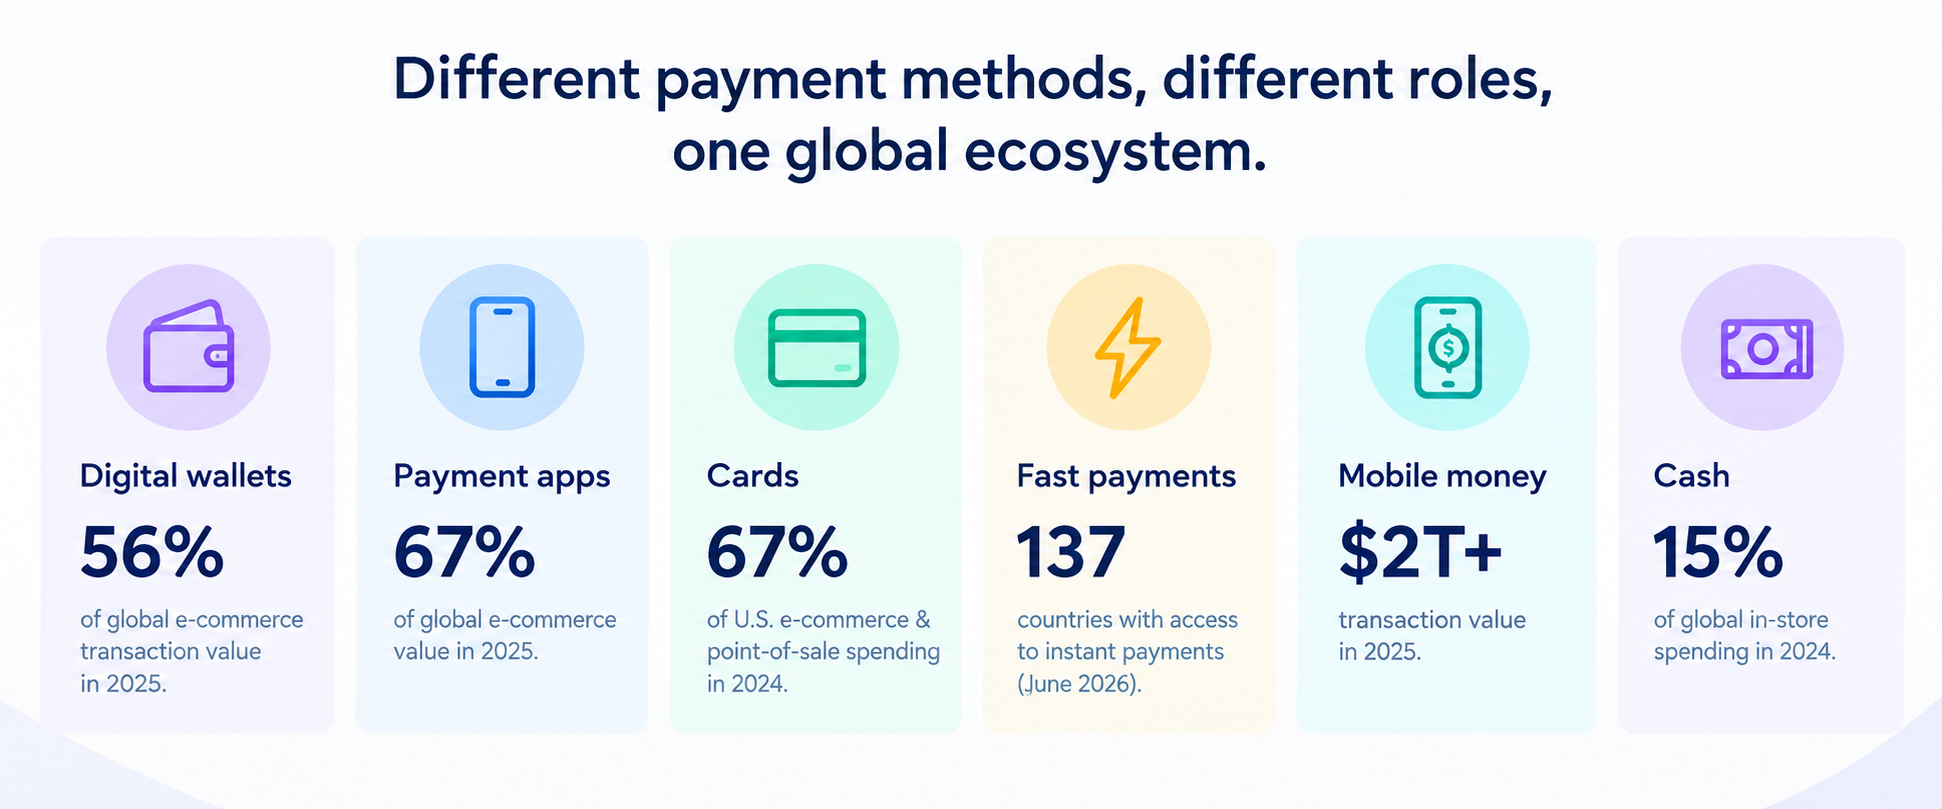
The strongest global payments benchmark is not a single adoption percentage. It is a view of how consumers, businesses, and payment systems use different rails across different markets.
| Payment area | Current benchmark | Adoption caveat | Business implication |
|---|---|---|---|
| Digital wallets | 56% of global e-commerce value and 33% of global in-person spending in 2025 | Value share is not user share; funding rails may be cards or bank accounts | Support relevant wallet ecosystems by market |
| Payment apps | 67% of global e-commerce value and 37% of point-of-sale value in 2025 | The category includes several different methods | Separate wallet, account-to-account, and other app activity |
| Cards | 67% of combined U.S. e-commerce and point-of-sale spending in 2024 | Direct card use can overlap with wallet funding | Distinguish card payments from card-funded wallets |
| Fast payments | Access in 137 countries as of June 2026 | Availability does not prove usage or interoperability | Assess acceptance, pricing, fraud controls, and settlement |
| Mobile money | More than $2 trillion in transaction value during 2025 | Registered accounts exceed active accounts | Track ownership, active use, and merchant payments together |
| Cash | 15% of global in-store spending in 2024 | Usage remains important in selected markets | Retain suitable support where access or preference requires it |
| Cross-border payments | More than $190 trillion in global market value | Retail corridors still face cost, speed, and compliance barriers | Benchmark currency, corridor access, settlement, and reconciliation |
Digital wallets and payment apps now lead online payment usage
Digital wallets represented 56% of global e-commerce transaction value in 2025 and 33% of global in-person spending, according to Worldpay’s payment-app analysis.
Worldpay’s broader payment-app category accounted for 67% of global e-commerce value and 37% of global point-of-sale value in 2025. This category includes digital wallets, buy now, pay later, account-to-account payments, and banking apps.
These figures describe transaction value. They do not represent the percentage of people who use wallets or the share of individual transactions made through them.
Digital wallets are also not a single underlying funding method. They can use tokenized cards, linked bank accounts, stored balances, or other payment instruments. The visible wallet is often only the front end. The underlying funding rail may still be a card or bank account.
Adoption also differs by region. Wallet brands and account-to-account schemes vary by market. A global average therefore cannot replace corridor-level analysis.
Worldpay forecasts that payment apps will account for 46% of global point-of-sale value by 2030, equivalent to about $15.6 trillion. This is a forecast, not a current benchmark. A merchant serving several regions may need different wallet ecosystems even when the checkout experience appears similar.
Cards remain central because wallets often depend on card funding
Cards remain important in both direct payments and digital-wallet funding. Worldpay reported that cards accounted for 67% of combined U.S. e-commerce and point-of-sale consumer spending in 2024, based on its 2025 report.
In the United States, digital wallets represented 40% of online transaction value and 17% of in-store point-of-sale value in 2025, according to Worldpay’s consumer payment research.
Worldpay also reported that 65% of Americans fund digital wallets with credit and debit cards in its 2025 market analysis. This means wallet growth does not necessarily indicate that cards have disappeared.
The shift can instead reflect a change in the interface, tokenization layer, or checkout experience. A card-funded mobile-wallet purchase may appear as a wallet transaction to the customer while relying on card authorization and network settlement underneath.
Businesses should distinguish direct card payments from card-funded wallet payments. Otherwise, they may double-count adoption or misread substitution between payment methods.
Fast payments and account-to-account rails are expanding beyond early-adopter markets
Retail fast payments provide immediate fund availability and can operate continuously. The World Bank defines fast payments as instant, real-time, immediate, or rapid payments.
As of June 2026, people and businesses in 137 countries had access to instant payment services, according to the World Bank’s fast-payment research. This is an infrastructure measure. It does not prove high usage or broad merchant acceptance.
An earlier World Bank survey found that an operational fast-payment system was available in 61% of respondent countries in 2023. It also found that 27 additional countries planned implementation within three years. This earlier result should not be presented as the current global count.
Usage is also increasing in lower-income markets. According to the Global Findex 2025 findings, 62% of adults in low- and middle-income economies made or received a digital payment in 2024. That was six percentage points higher than in 2021.
Worldpay projects global account-to-account e-commerce spend to reach $936 billion by 2030, up from $152 billion in 2014. This is a forecast based on expected future spending.
Fast-payment infrastructure becomes useful when it supports everyday commerce, government payments, and business settlement. Adoption also depends on interoperability, merchant acceptance, pricing, trust, fraud controls, and regulatory design.
Mobile money is a major adoption engine in emerging markets
Mobile money is a core part of financial-access infrastructure in many markets. It supports person-to-person transfers, merchant payments, bill payments, and other financial services.
The GSMA reports that mobile money processed more than $2 trillion in transaction value during 2025. Its industry report recorded 2.3 billion registered accounts and 593 million active 30-day accounts.
Transaction value grew 23% in 2025, while transaction volume grew 16%. The GSMA stated that this was the first time in four years that value growth exceeded volume growth.
Merchant payments were the fastest-growing mobile-money use case cited by GSMA. Their value increased by almost half to $155 billion in 2025, according to the GSMA industry data.
Account ownership is also expanding in Sub-Saharan Africa. The World Bank’s Global Findex 2025 reporting says 40% of adults in the region had a mobile-money account in 2024, up from 27% in 2021.
Registered accounts and active accounts are different benchmarks. A market can report very high registered-account adoption while having a much lower monthly active-usage rate. Both figures should appear together in a serious benchmark.
Cash is declining globally, but adoption remains uneven and incomplete
Cash is losing global share, but it is not disappearing. Worldpay reported that cash’s share of global in-store spending fell from 44% in 2014 to 15% in 2024.
Worldpay also states that cash usage has reached a relative plateau in many markets. It forecasts a global decline of approximately 2% compounded annually through 2030. This is a forecast, not a current result.
Account ownership does not automatically lead to digital merchant payments. The World Bank’s Global Findex 2021 account-use data found that 1.6 billion adults with an account in developing economies made merchant payments in cash only. About 620 million account-owning adults paid utility bills in cash.
Connectivity remains another barrier. Global Findex 2025 research reports that 31% of adults without financial accounts in low- and middle-income economies also do not own mobile phones.
Cash usage varies by geography, age, merchant infrastructure, income, privacy preferences, and perceived reliability. A falling global share does not mean that every consumer, business, or corridor is ready for digital-only payments.
A business may need digital acceptance for online commerce while retaining cash or alternative-payment support for local customers, unbanked users, or markets with weaker acceptance infrastructure.
Cross-border payment adoption is growing, but speed, cost, and compliance remain decisive
The global cross-border payments market reached approximately $190 trillion in 2023, including wholesale and retail transactions, according to the IMF’s cross-border payments analysis. The BIS subsequently described the 2024 market as exceeding $190 trillion, while noting that the market could surpass $300 trillion within five to ten years. The latter figure is an estimate, not a settled benchmark.
Retail cross-border payments still lag domestic payments in cost, speed, access, and transparency. The BIS identifies complex payment chains as a major reason, making reliable cross-border execution an important consideration for businesses. Its Innovation Hub has valued the retail cross-border payments market at more than $800 billion annually
Compliance, market infrastructure, foreign-exchange services, and settlement procedures all add complexity. As a result, global businesses should evaluate adoption at the corridor level.
The relevant questions include:
•Which currencies and payment rails are supported?
•How quickly do funds settle?
•What conversion steps and costs apply?
•What compliance controls and exceptions exist?
•How much reconciliation work does each route create?
•Is the corridor available for collections, supplier payments, or both?
For finance and supply-chain teams, the key question is not simply which payment method is popular. It is whether funds can move through the required corridor with acceptable speed, compliance, conversion, and settlement outcomes.
Fuze Business is relevant as an example of a unified platform positioned around cross-border payments, sending, receiving, and currency conversion. Its listed capabilities include difficult trade corridors, AED, CNY, and EUR support, banking network access, instant currency and stablecoin conversion, enterprise-grade compliance, and faster settlement.
How finance and supply-chain teams should interpret adoption benchmarks
Consumer payment-share data helps explain checkout behavior. It does not measure business-to-business settlement, supplier payments, treasury workflows, or cross-border transaction performance.
Finance managers should track payment-method mix, failed or declined payments, settlement timing, conversion exposure, reconciliation effort, compliance exceptions, and corridor coverage where data is available.
Teams should also separate payment use cases. Customer collections, supplier disbursements, payroll, government payments, treasury transfers, and merchant payments can require different rails and controls.
Fast settlement may improve liquidity timing. However, adoption claims should not imply guaranteed savings or operational outcomes without measured business data.
A practical benchmark dashboard can include:
•Corridor and currency
•Payment rail
•Transaction share
•Median settlement time
•Conversion step
•Compliance status
•Failed-payment rate
•Reconciliation status
•Total operational effort
How Fuze Business helps with global payments
For businesses managing international payments, Fuze Business brings sending, receiving, currency and stablecoin conversion, settlement, and transaction tracking into one platform across supported corridors.
Businesses can use a unified account to manage payment workflows, while the platform provides visibility into transaction status and reconciliation. Depending on the corridor and payment method, businesses can also access different settlement options, including stablecoin-powered settlement.
Fuze Business also provides transparent pricing, with the applicable exchange rate and fees shown before payment confirmation. Availability, settlement times, and supported currencies depend on the specific corridor, payment method, counterparty, and applicable regulatory requirements.