

A difficult trade corridor is a cross-border goods or payment route with structural friction. Weak logistics, limited correspondent banking, sanctions or AML/CFT complexity, currency constraints, low transparency, and unreliable settlement can all contribute.
The phrase is an analytical framework, not a universally standardized statistical category. Corridor difficulty is best assessed through measurable factors, including cost, speed, access, transparency, logistics reliability, compliance workload, and settlement certainty. Geography alone does not determine whether a route is difficult.
What makes a trade corridor difficult?
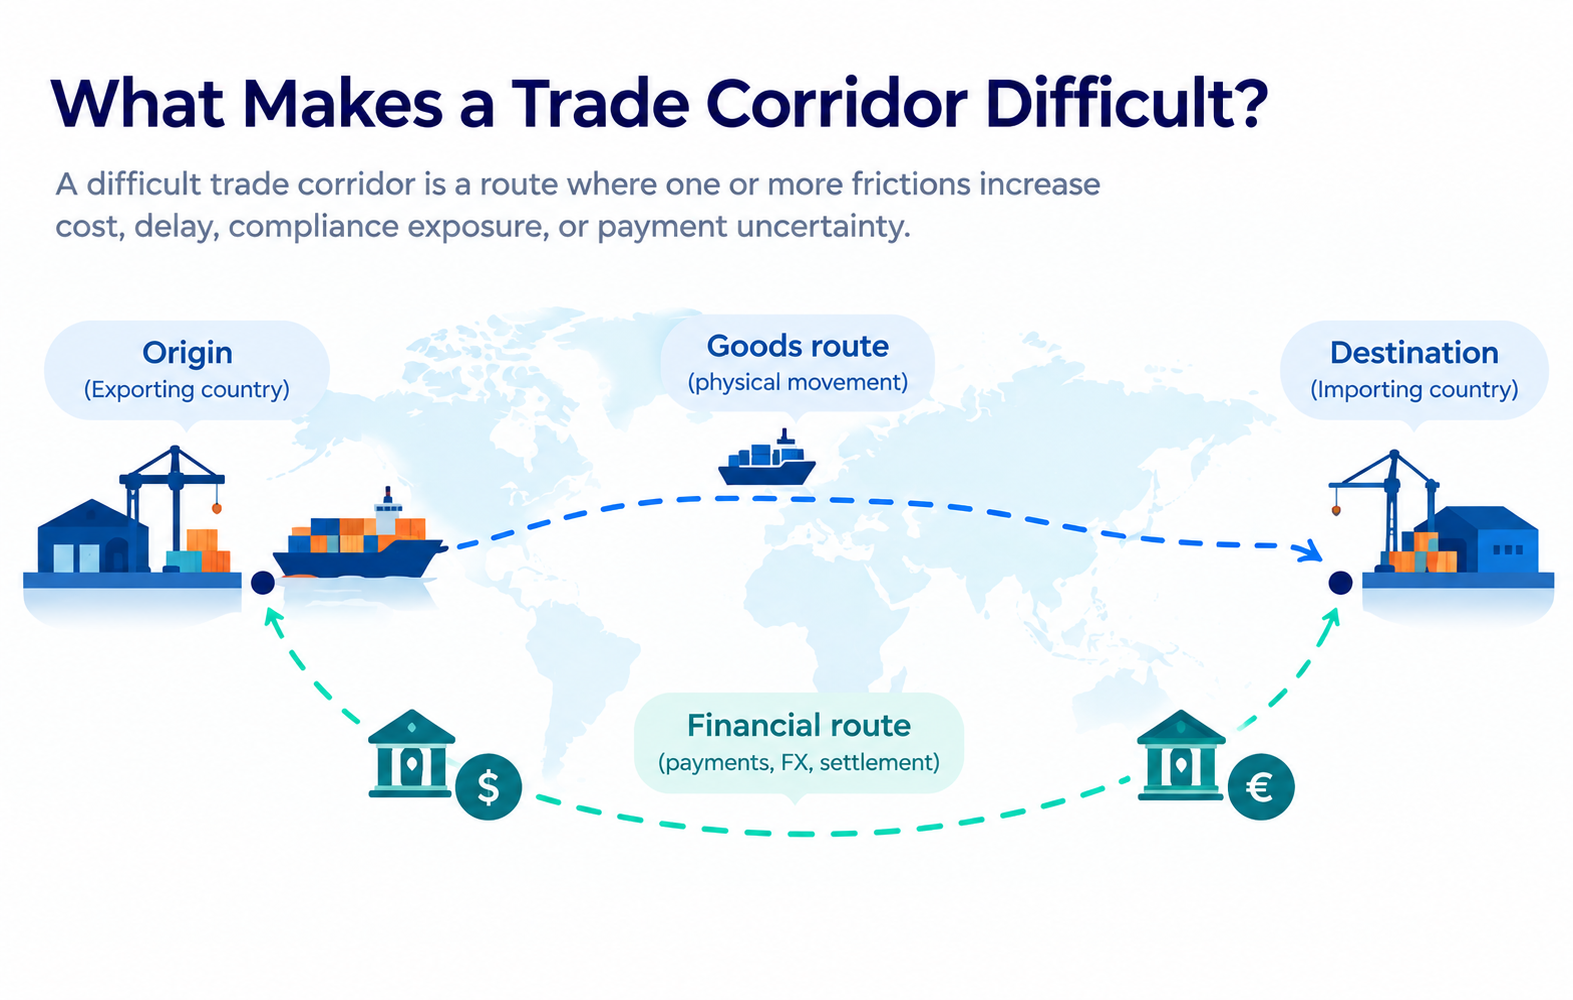
A trade corridor consists of two connected systems.The first is the physical trade lane that moves goods. The second is the financial corridor that settles cross-border payments and transfers funds.
A route becomes difficult when several frictions combine. These may include border controls, weak transport infrastructure, route disruption, fragmented regulations, limited correspondent banking, foreign-exchange constraints, or elevated compliance requirements.
The Financial Stability Board identifies cost, speed, transparency, and access as the core challenges for cross-border payments. The World Bank’s logistics framework assesses how effectively goods move across borders. It covers logistics services, trade and transport infrastructure, and border controls.
The same corridor can perform differently by product, currency, payment method, and compliance profile. “Difficult” should therefore describe an operating condition, not a permanent label for a country or region.
A useful definition is: A difficult trade corridor is a route where moving goods and settling payment require more time, cost, coordination, or risk management than comparable routes.
| Dimension | What to assess |
|---|---|
| Physical movement | Transit time, border delays, route disruption, and delivery variance |
| Payment access | Available payment providers, banking relationships, and sending or receiving options |
| Compliance complexity | Screening, beneficial-owner checks, documentation, and review requirements |
| FX availability | Supported currencies, conversion points, pricing, and liquidity |
| Settlement reliability | Time to funds availability, reconciliation, tracking, and fallback options |
For example, the World Bank reported an average of 44 days from container entry at the exporting-country port to departure from the destination port across potential trade routes. A payment route may also require several intermediaries and additional screening. These difficulties can compound rather than operate separately.
Why difficult corridors become more expensive and less predictable
Cross-border payments usually involve more steps than domestic payments. Currency conversion, intermediary-bank processing, compliance checks, and information exchange can all add time or cost.
The BIS reported a 20% decline in active correspondent banks between 2011 and 2018. Countries with more limited correspondent-banking access tend to face higher payment costs.
When direct correspondent relationships are unavailable, payments may pass through longer chains. Each additional intermediary can increase operational complexity, fees, and uncertainty about the final settlement time.
The Financial Action Task Force has also identified inconsistent national AML/CFT implementation as a source of friction. This can affect customer verification, beneficial-owner checks, sanctions screening, information sharing, and correspondent-banking relationships. The causes differ by corridor, so businesses should avoid treating every difficult route as having the same problem.
Physical routes face their own disruptions. Maritime shipping carries more than 80% of world trade, and rerouting around the Cape of Good Hope increased ton-miles to a record 6% in 2024.
These examples should be assessed separately first. Red Sea rerouting is a physical-corridor problem. Correspondent-bank withdrawal is a financial-corridor problem. Their effects overlap when longer transit times delay invoicing, increase working-capital needs, or create uncertainty about when payment will settle.
Technology can reduce processing friction. It does not remove sanctions obligations, local-currency constraints, border controls, or the need for regulated access. The hardest corridors are difficult twice: the goods route faces disruption, while the payment route faces fragmented access and compliance demands.
Global trade and corridor usage trends through 2025 and 2026
Global trade can keep expanding while individual corridors become harder to use. Aggregate growth does not guarantee reliable access on every route.
The WTO’s March 2026 outlook reported that world merchandise trade volume grew 4.6% in 2025. Its baseline projected growth of 1.9% for 2026.
The same outlook reported the following 2025 values:
•World merchandise exports: US$26.26 trillion
•Services trade: US$9.56 trillion
•Total goods-and-services trade: US$34.65 trillion
Services represented 27.5% of global trade in 2025. That was the highest share since 2005. This supports a broader view of trade corridors that includes logistics, finance, digital services, and settlement activity.
UN Trade and Development projected that global trade would exceed US$35 trillion in 2025. It also identified East Asia, Africa, and South–South trade as important growth drivers while noting that geopolitical fragmentation was reshaping trade flows.
At the same time, maritime trade growth was expected to slow from 2.2% in 2024 to 0.5% in 2025. This shows why headline trade growth and physical-route performance should not be treated as interchangeable.
The contrast is important: world merchandise trade volume grew 4.6% in 2025, while the maritime-trade growth outlook for 2025 was 0.5%. These datasets measure different layers of the trade system.
The WTO also identified trade-policy uncertainty, tariffs, AI-related goods, energy prices, and geopolitical developments as factors that could change route demand and corridor performance. Global totals measure trade value or volume. They do not show whether a specific corridor is fast, affordable, transparent, or accessible.
Benchmarks for measuring difficult trade corridor performance
Businesses should measure a corridor across payment and physical-trade dimensions. The main payment categories are cost, speed, access, transparency, and reliability.
The G20 cross-border payment targets provide useful reference points:
•By the end of 2027, 75% of cross-border wholesale payments should be credited within one hour. The remainder should be credited within one business day.
•For cross-border retail payments, funds should be available within one hour for 75% of payments by the end of 2027. The remainder should be available within one business day.
•By 2030, the global average cost of sending US$200 in remittances should be no more than 3%. No corridor should exceed 5%.
•Financial institutions operating in all payment corridors should have at least one option for sending and receiving cross-border wholesale payments by the end of 2027.
The G20 payment targets also support measuring same-day reconciliation, transparency, and access. A payment is not genuinely accessible if it can be initiated but cannot be priced transparently, settled predictably, or reconciled efficiently.
A practical corridor scorecard can combine official payment objectives with company-level operating measures:
| Metric | Why it matters | Corridor-specific question |
|---|---|---|
| Total cost | Shows the full economic burden | What are the provider, intermediary, and FX charges? |
| Time to funds availability | Measures settlement speed | When can the recipient use the funds? |
| Payment access | Tests whether the route is available | Can the required parties send and receive funds? |
| Transparency | Reveals pricing and status visibility | Are fees, timing, tracking, and terms clear? |
| Settlement reliability | Measures predictability | How often do payments settle within the expected window? |
| FX-conversion certainty | Shows currency risk | Which currencies and conversion paths are available? |
| Intermediary count | Indicates operational complexity | How many institutions may handle the payment? |
| Compliance workload | Estimates process requirements | What information and documents are required? |
| Transit time | Measures physical movement | How long does the goods route usually take? |
| Delivery variance | Shows reliability | How often does delivery differ from the promised time? |
The final five physical and operational measures are proposed editorial categories, not standardized global benchmarks in the cited sources. Companies should set targets using actual corridor data.
Logistics indicators can include border dwell time, port-to-port or door-to-door transit time, rerouting frequency, and customs-document error rates. These measures should sit beside payment data rather than replace it.
How businesses can evaluate access before expanding into a difficult corridor
Finance managers and global trade companies should assess the commercial route and settlement route before committing to a corridor. The question is not only whether a payment can be sent. It is whether the business can forecast arrival and reconcile transactions at scale.
A corridor review should record:
•The physical and financial route
•Supported currencies and available payment options
•Expected settlement timing
•All-in fees and FX conversion points
•Required compliance information
•Documentation responsibilities
•Fallback payment or logistics options
The FSB notes that cross-border payment data are fragmented across end-users, payment providers, infrastructures, and jurisdictions. A corridor-specific evidence file is therefore more useful than relying only on global averages.
Businesses can compare planned performance with G20 targets for cost, speed, access, and transparency. They should also use logistics measures to test the goods route and apply cross-border transaction optimization practices to improve cost, settlement reliability, and operational resilience.
Compliance should be treated as an operating requirement, not a one-time approval step. Transaction information, counterparties, currencies, and routes can affect screening and review requirements. FATF guidance on cross-border payments supports assessing these requirements as part of the payment process.
For example, a finance manager comparing an AED, EUR, or CNY settlement route should record the available conversion path, expected timing, compliance documentation, and total cost. Availability must be verified for the specific transaction and customer profile.
Verified external benchmarks should also be separated from company-specific service-level targets. A global benchmark can guide the review, but actual corridor data should determine the operating target.
How Fuze Business helps businesses access difficult trade corridors
Difficult trade corridors require more than a payment button. Businesses need access, currency flexibility, compliance support, and a clearer path to settlement.
Fuze Business brings these cross-border payment capabilities together in one platform. Its supplied capabilities include access to difficult trade corridors, banking network access, AED, USD, GBP, EUR support & more, cross-border payments and transactions, instant conversion of currencies and stablecoins, enterprise-grade compliance, and faster settlement.
For a business evaluating any currency settlement requirement, these capabilities can help organize the payment and currency needs within one operating environment. Specific corridor or counterparty availability should still be verified for the transaction and customer profile.
For businesses evaluating payment access in difficult corridors, Explore Fuze Business to assess its available payment, conversion, and settlement capabilities.